


Chartmere Jira charts on Confluence pages: pie, bar, stacked, line, created vs resolved and 2D tables from any JQL, counted for each reader
Listed on the Atlassian Marketplace as “Chartmere: Work Item Charts and Reports for Confluence”
From $11 a month for up to 10 users. Billed by Atlassian, with a 30-day free trial.
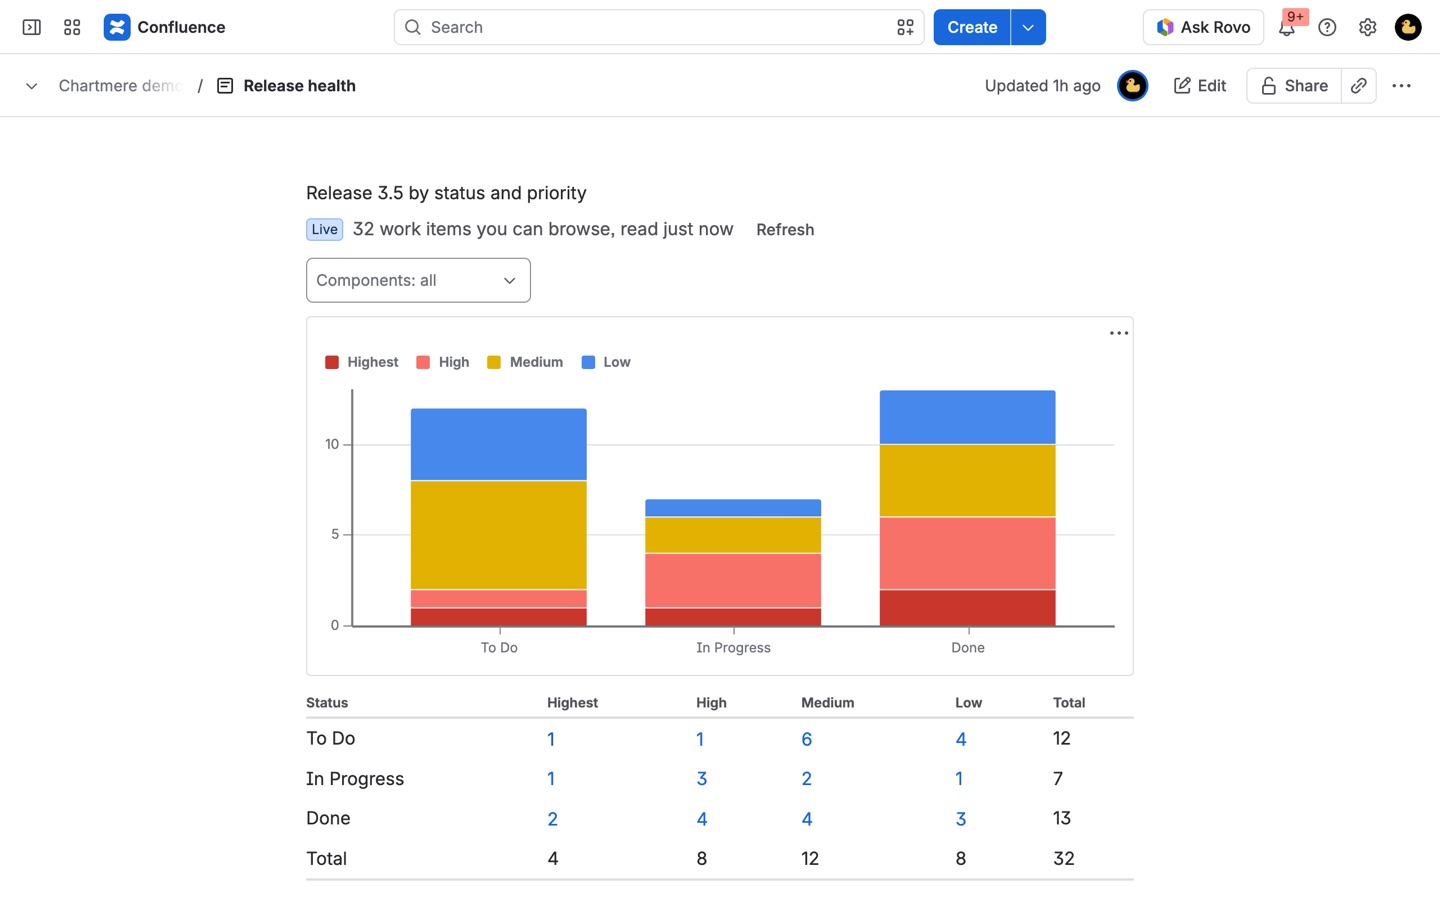
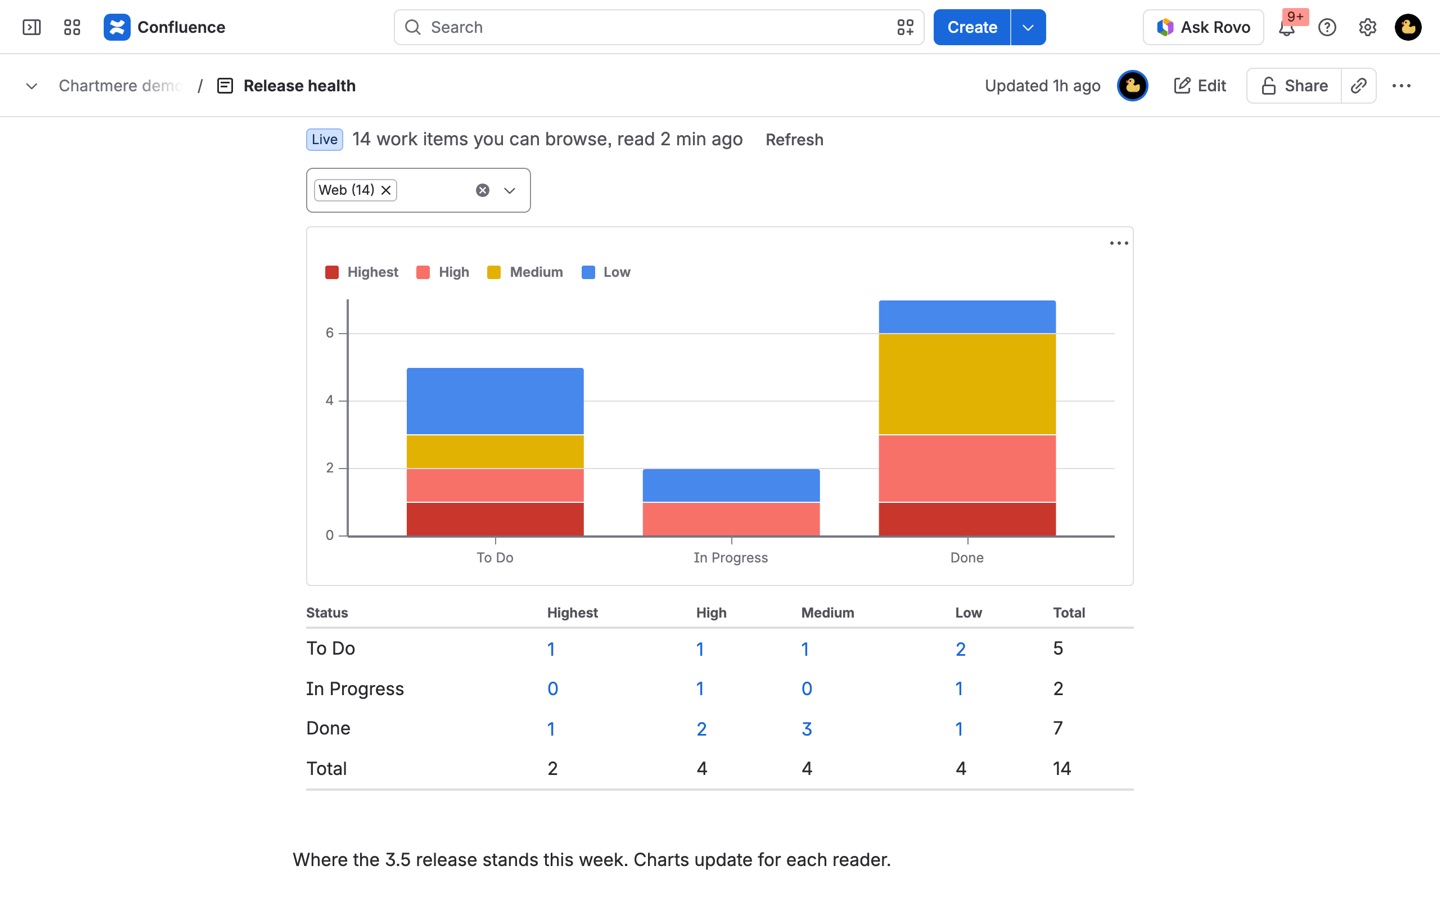
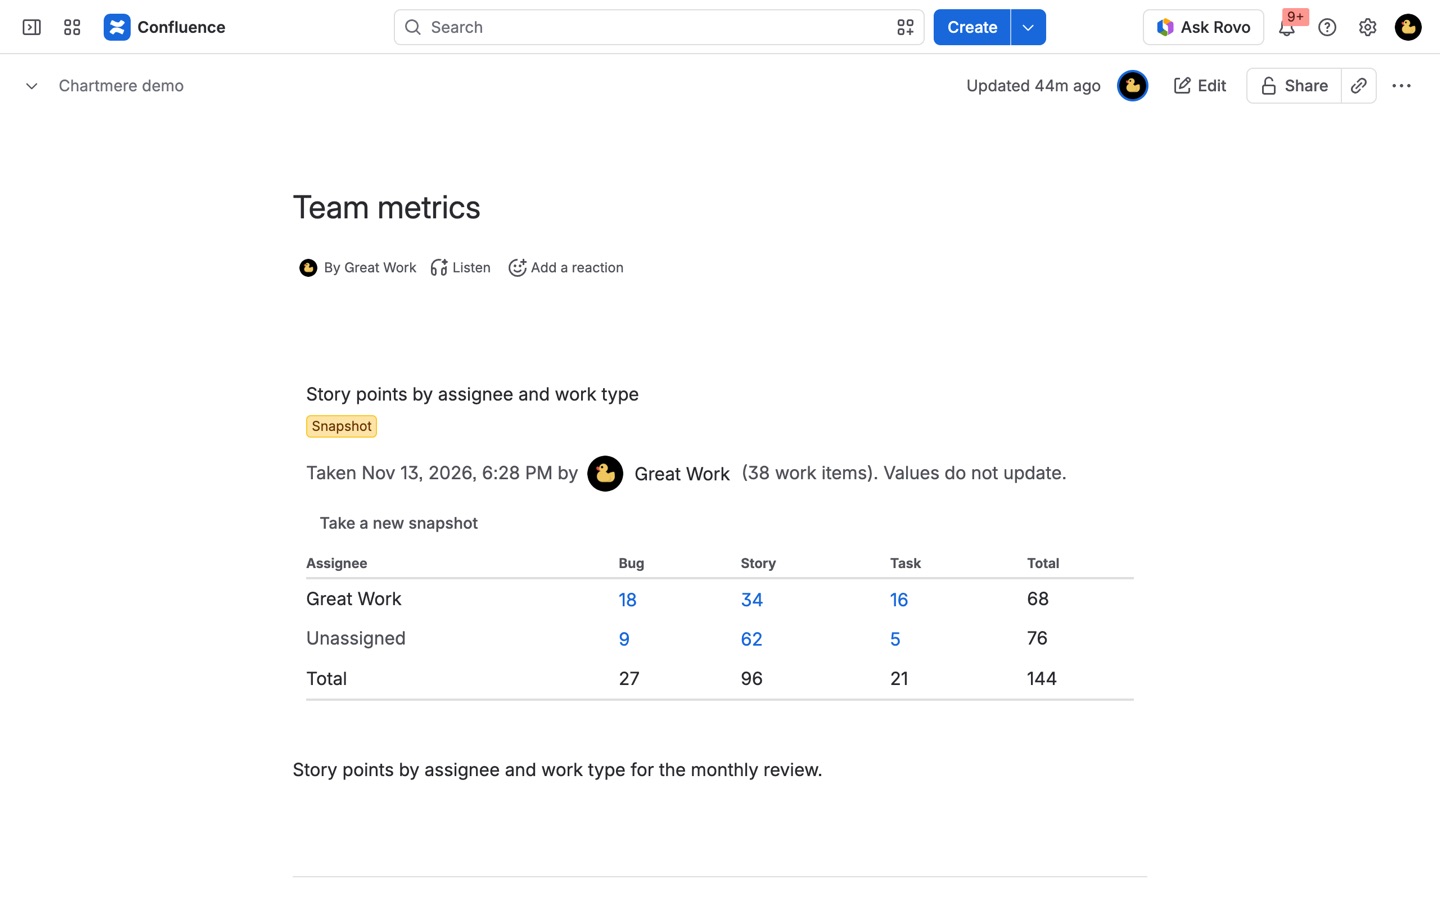
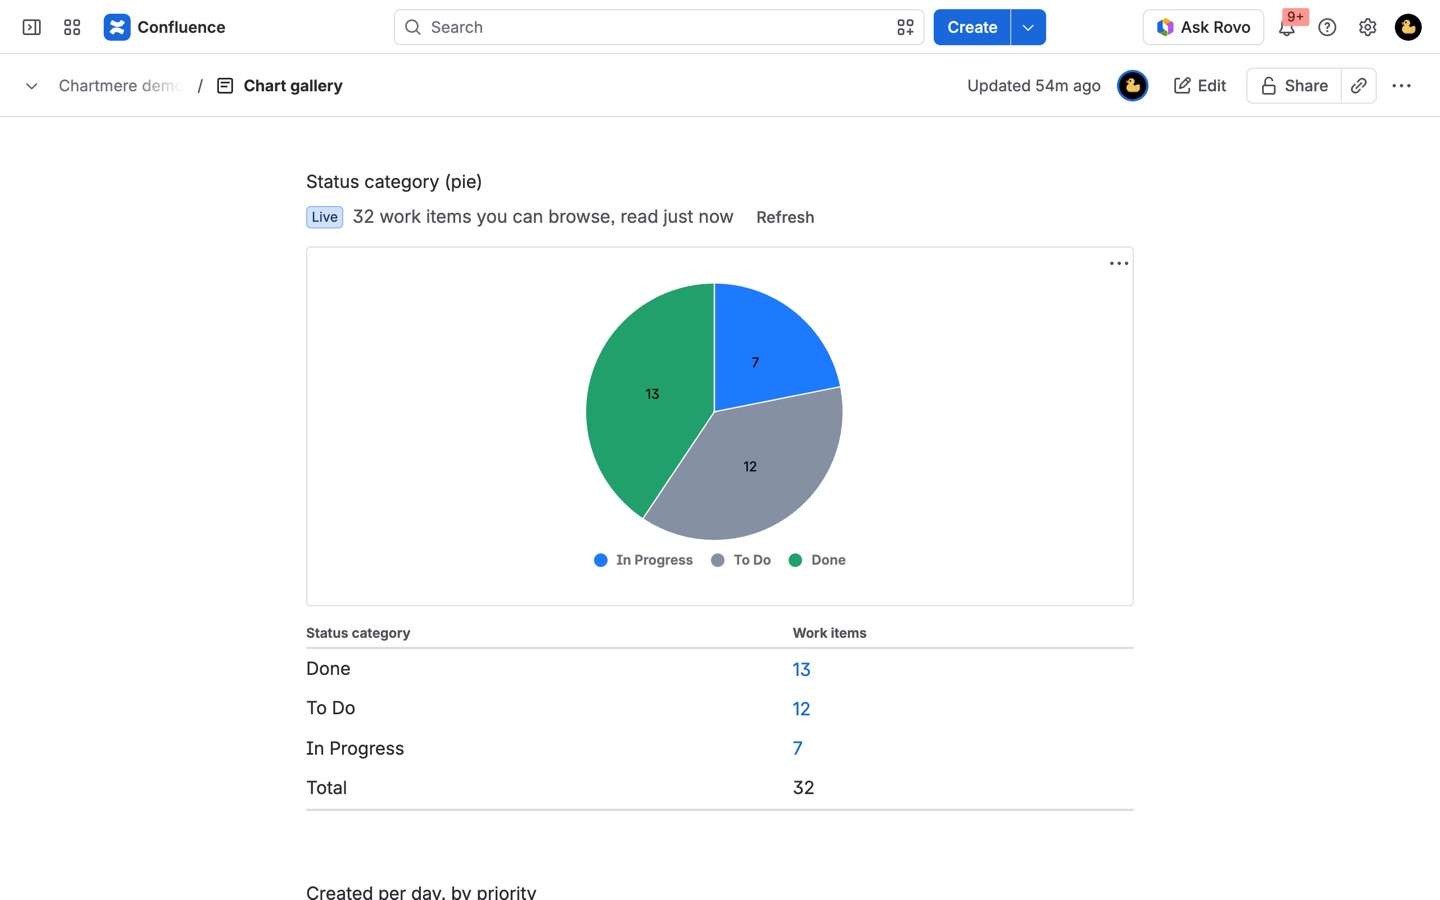
Chart any JQL on a Confluence page by any Jira field, custom fields included: counts, story point sums or averages, by week or month. Every reader sees only work items they can browse. Snapshots, reader filters, PDF and Word export.
What you get
Any Jira field, any chart, on the page
Pie, bar, stacked, line, created vs resolved and two-dimensional tables over any JQL. Group by custom fields, labels, sprints or dates, and sum or average story points and hours.
Every reader sees only what they can browse
Live charts count only the work items each reader can open in Jira, issue security included. Readers can narrow a chart with the filters you offer, and click any number to open those work items.
Snapshots and PDF export for the record
Freeze a chart with its date for a release sign-off or monthly report. PDF and Word exports carry the chart as a picture and the numbers as a table, so the document matches the page.
How Chartmere works
- Install Chartmere on Confluence and connect it to Jira on the same site, in Atlassian Administration > Apps > Chartmere. Confluence settings > Chartmere shows whether the connection works.
- Edit a page and type /Jira chart (Chartmere). The settings panel opens.
- Enter the JQL, for example
project = ABC AND fixVersion = "3.5", or a saved filter such asfilter = 12345. - Pick the chart and the field to group by. Choose what to measure: a count of work items, or the sum or average of a number field such as Story point estimate or time tracking in hours.
- Press Save. Chartmere checks the JQL with Jira and counts the work items you can browse, so a typo shows Jira's own message instead of an empty chart.
- Publish the page. Each reader sees the chart counted from what they can browse, a table of the numbers under it, and each number links to exactly those work items in Jira (all but the "Other" group).
Who it's for
Teams that report on Jira in Confluence
A weekly status page, a sprint review or a release page lives in Confluence, but the numbers live in Jira. A stacked bar of status by priority or a line of work resolved per week sits on the page itself and updates when the page is read.
Anyone grouping by a custom field
Team, Customer, Severity or any select list you've added to Jira can group a chart. So can labels, sprints, parent, status category and dates by day, week, month, quarter or year.
Managers who need numbers for the record
Press Take snapshot on the published page to freeze a chart with its date and who took it, for a release sign-off or a monthly report. Everyone who can view the page sees the frozen values, even people without Jira access.
Pages shared with mixed audiences
Because live charts count only the work items each reader can browse, issue security levels included, one page can serve a whole department without showing anyone work they couldn't open in Jira.
Chartmere or Confluence's built-in Jira chart
Confluence's own Jira chart macro has three charts: pie, created vs resolved and two-dimensional. They group by six fields (status, fix version, assignee, priority, component and work type) and count work items. If that covers your report, you don't need an app.
Chartmere adds bar, stacked bar and line charts, grouping by any field with values, sums and averages of number fields, reader filters, snapshots, and PDF and Word exports that carry the chart as a picture with its numbers as a table. It reads Jira and Confluence and never changes them.
Limits
- A chart reads up to 5,000 work items by default (a Confluence admin can change it). Larger results use the first matches and the chart says so.
- Charts keep the biggest values and fold the rest into "Other".
- A work item with two labels counts under both, so parts of a multi-value field can add up to more than the total. The chart says so under the numbers.
- JQL functions that answer differently per person searching, such as
watchedIssues(),votedIssues()andissueHistory(), are refused, since a live chart is counted per reader. - Readers who aren't signed in see a message instead of a live chart; snapshots show to anyone who can view the page.
Chartmere guides
Questions about Chartmere
What does Chartmere do?
Jira charts on Confluence pages: pie, bar, stacked, line, created vs resolved and 2D tables from any JQL, counted for each reader. Chart any JQL on a Confluence page by any Jira field, custom fields included: counts, story point sums or averages, by week or month. Every reader sees only work items they can browse. Snapshots, reader filters, PDF and Word export.
What does Chartmere work with?
Chartmere works in Confluence Cloud.
How much does Chartmere cost?
$11 a month for up to 10 users, or $110 a year. From 11 users: $2.55 per user a month, with lower rates for larger sites.
Is there a free trial?
Billed by Atlassian, with a 30-day free trial.
Where do I install Chartmere?
From the Atlassian Marketplace. Use the Install button on this page, or search for "Chartmere: Work Item Charts and Reports for Confluence" there.
Who makes Chartmere?
Great Work LLC, an independent software company. Email hello@greatwork.company with any question about Chartmere and someone will answer.
Can a Jira chart in Confluence group by a custom field?
Yes. Any Jira field with values can group a Chartmere chart, including select lists, number fields, teams and dates by period.
Can I chart story points instead of counting work items?
Yes. Set the measure to sum or average and pick the number field, such as Story point estimate. A pie chart can count or sum but not average.
Do readers without Jira access see the chart?
They see a snapshot if one was taken. A live chart counts only what the reader can browse in Jira, so someone without access to a space sees a chart without that space.
Can readers filter the chart on the page?
Yes. Offer up to three filter fields, such as Component, Assignee or Team, in the chart settings. What a reader picks narrows their view and isn't saved.
Does currentUser() work in the JQL?
Yes. It means the person reading the page, so assignee = currentUser() shows each reader their own work.
How fresh are live charts?
Each reader's result is kept for 5 minutes by default, only for them. Refresh always reads Jira again.
Do charts appear in PDF exports?
Yes. PDF and Word exports carry the chart as a picture and the numbers as a table, counted for the person exporting or, for a snapshot, as frozen.
More Confluence apps
 Clean Copy
 Sprigwell
 Dibs
 Sheetkeep