



ReadoutKPI gauges, big numbers, targets and bar charts for any Jira filter or JQL. Click any value to open the exact issues behind it.
Full name: “Readout: KPI Gauge, Number and Bar Chart Gadgets for Jira”
From $6 a month for up to 10 users. Billed by Atlassian, with a 30-day free trial.
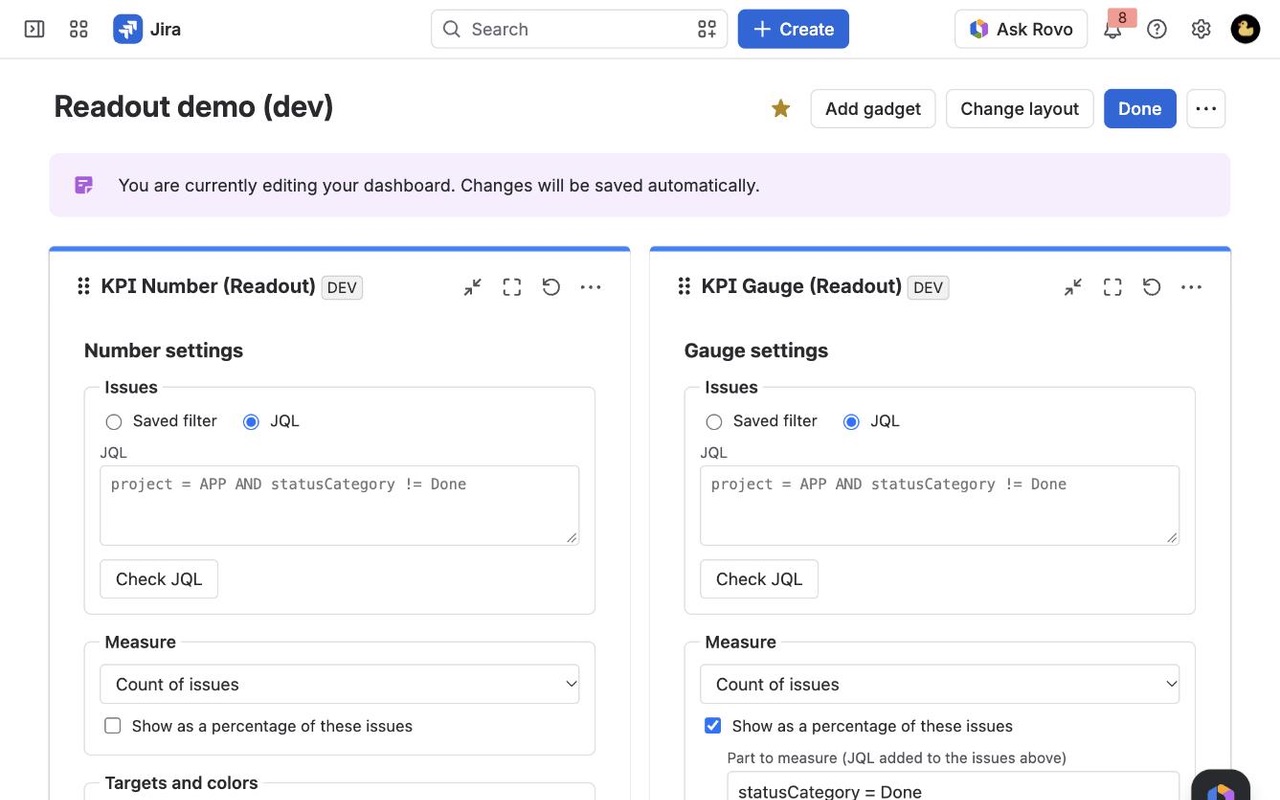
KPI gadgets for the new Jira dashboards and classic ones: a gauge, a big number with trend, a progress-to-target bar and a bar chart by any field, including custom fields and dates. Count or add up any number field. Click through to the issues.
What you get
Gauges, numbers and targets for any filter
Show a count, a sum of story points or time, or a percentage like done of total. Set red, yellow and green zones, a target and a trend since last week.
Bar charts by any field, even custom ones
Group by custom select lists, cascading fields, sprints, labels, people or dates per month. Stack by a second field. Only values used in your filter appear, never N/A.
Click any value to open its issues
Every gauge, number, bar and stacked segment opens the issue navigator with exactly the issues it counts, so a red number turns into a to-do list in one click.
Questions about Readout
What does Readout do?
KPI gauges, big numbers, targets and bar charts for any Jira filter or JQL. Click any value to open the exact issues behind it. KPI gadgets for the new Jira dashboards and classic ones: a gauge, a big number with trend, a progress-to-target bar and a bar chart by any field, including custom fields and dates. Count or add up any number field. Click through to the issues.
What does Readout work with?
Readout works in Jira Cloud.
How much does Readout cost?
$6 a month for up to 10 users, or $60 a year. From 11 users: $0.60 per user a month, with lower rates for larger sites.
Is there a free trial?
Billed by Atlassian, with a 30-day free trial.
How do I get Readout?
Email hello@greatwork.company and we'll help you get Readout set up.
Can I click a gauge or bar to see the issues?
Yes. Every value, bar and segment opens exactly the issues it counts.
Can it show something other than issue counts?
Yes: sum, average, minimum or maximum of any number field, including story points and time spent in hours.
Can I chart by week or month?
Yes. Group by any date field per day, week, month, quarter or year.
Can colors go the other way for targets like "fewer is better"?
Yes: choose Lower is better.
Does it work on wallboards?
Yes. Set Refresh on wallboards and the gadget refreshes on its own. Errors show as text, not an endless spinner.
Why use this instead of the charts on the new Jira dashboards?
Readout takes any saved filter or JQL, groups and sums by custom fields, adds gauges, single numbers and targets with thresholds, and opens the exact issues behind every value. It works on classic and new dashboards.
Who makes Readout?
Great Work LLC, an independent software company. Email hello@greatwork.company with any question about Readout and a person will answer.
More Jira apps
 Relabel
 Rankwell
 Remindwell
 Querykin